Airline Delay Lengths Analyzed for July 2026
An analysis of U.S. airline on-time data for July 2026 reveals which carriers have the longest delays, with JetBlue and Frontier performing worst.
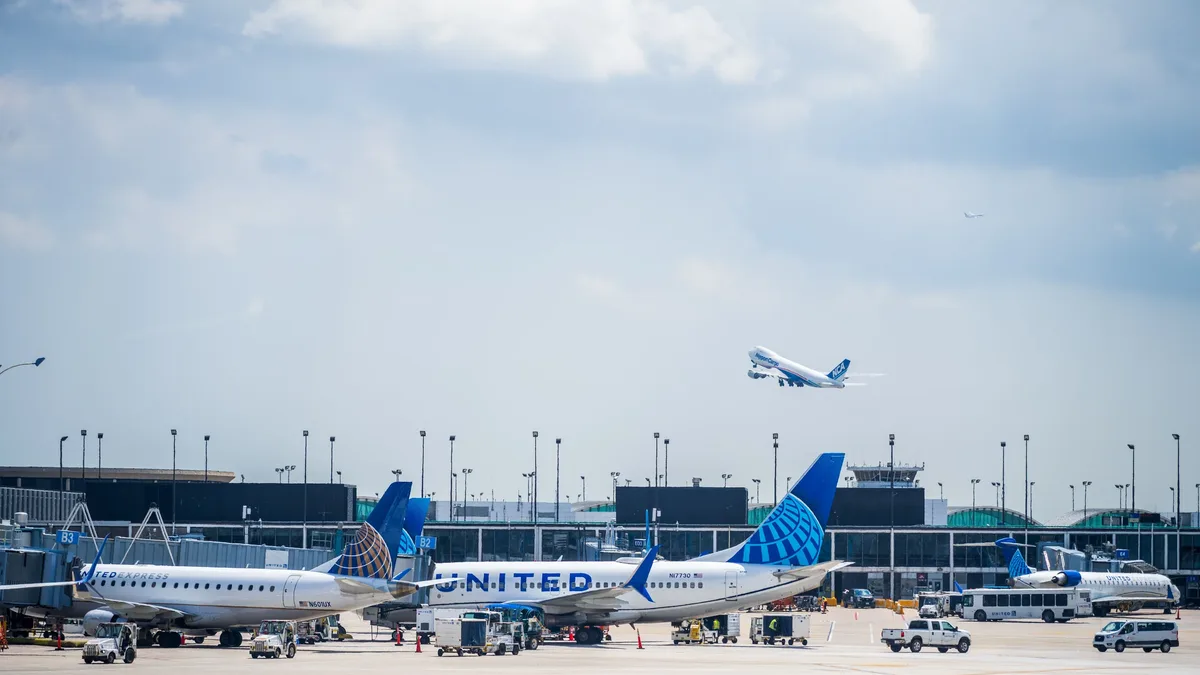
An analysis of airline delay data for July 2026 shows which carriers are most likely to strand passengers for hours. The data, sourced from Anuvu and examined by the Cranky Flier blog, breaks down delays by length for major U.S. marketing airlines.
Instead of just averaging delay times, the study categorized delays into bands. This method prevents skewed results. The data includes regional airline operations under each major carrier's brand.
Overall Airline Delay Performance
The analysis measured the percentage of flights arriving within 14 minutes of schedule, the standard for on-time performance. Alaska Airlines and Hawaiian Airlines led the pack. Delta Air Lines came next, with United Airlines close behind.
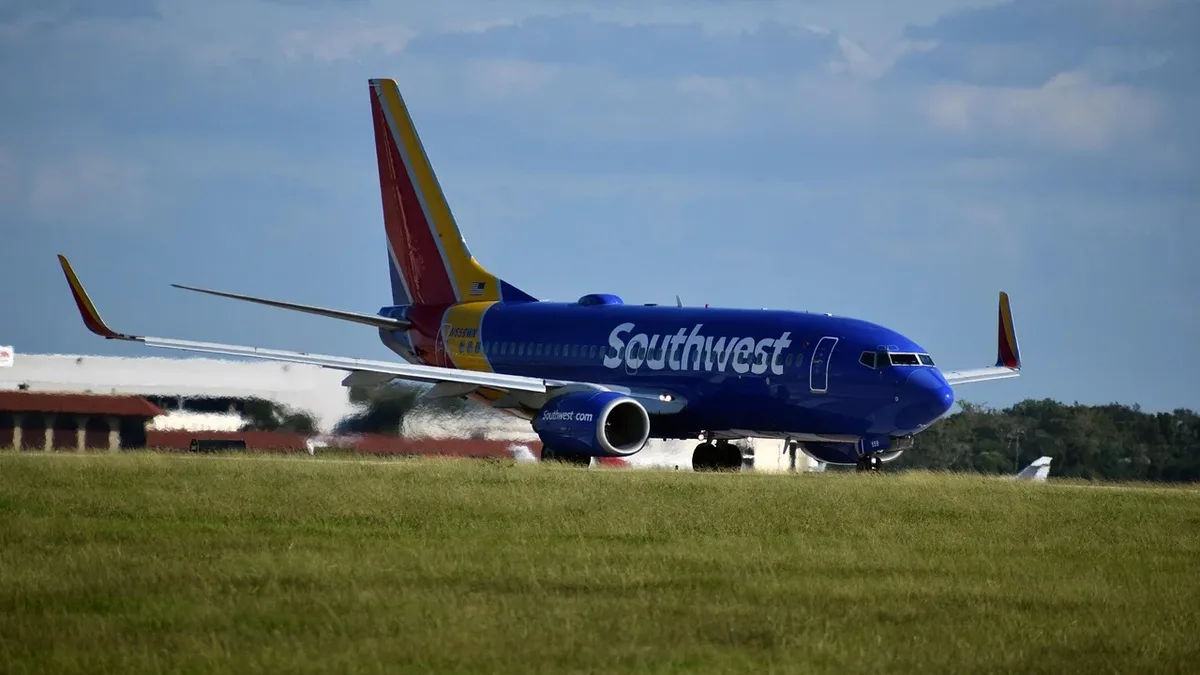
JetBlue had a difficult summer. Frontier Airlines also performed poorly. Southwest Airlines had a high number of delays, but most were short. On a recent podcast, Southwest's COO Andrew Watterson said many of its delays were brief and less disruptive. The data supports this. Southwest had the most delays in the 15 to 60 minute category. Combining flights arriving within 60 minutes, Southwest ranked third behind Alaska and Hawaiian.
Longer delays tell a different story. Nearly 10 percent of JetBlue's flights were delayed one to two hours. Frontier and Allegiant followed. Among the largest carriers, American Airlines was the worst performer for one to two hour delays. United did relatively well.
For delays exceeding two hours, JetBlue was again the worst. Frontier and Allegiant followed. American was tied with Allegiant in this severe delay category. Breeze Airways had a notable number of very long delays.
| Airline | Flights On-Time (A14) | Delays 15-60 Mins | Delays 1-2 Hours | Delays Over 2 Hours |
|---|---|---|---|---|
| Alaska/Hawaiian | Lead | Not Specified | Not Specified | Not Specified |
| Delta | High | Not Specified | Not Specified | Not Specified |
| United | Close to Delta | Not Specified | Lower | Not Specified |
| JetBlue | Low | Not Specified | ~10% | Highest |
| Southwest | Low | Most | Not Specified | Not Specified |
| Frontier | Low | Not Specified | High | High |
| Allegiant | Not Specified | Not Specified | High | High |
| American | Not Specified | Not Specified | Worst of Big 3 | Tied with Allegiant |
| Breeze | Not Specified | Not Specified | Upper Middle | High |
Note: The source provides comparative rankings and percentages for categories but not complete, uniform figures for all airlines in all bands. The table reflects the relative positions described.
Regional Airline Variations
The blog also examined delay performance for the branded regional airlines of four major carriers. For Alaska Airlines, there was little difference between mainline, SkyWest, and Horizon Air operations.
Significant variations appeared for others. Under Delta, SkyWest had over 81 percent of flights on-time (A14). Endeavor Air had under 68 percent. Endeavor also had nearly eight percent of flights delayed over two hours, compared to just over five percent for Republic Airways and under four percent for SkyWest.
For United, the pattern was different. Mesa Airlines and CommuteAir were best, with over 80 percent on-time. SkyWest was worst at just over 72 percent. Mesa had the fewest long delays.
American Airlines showed the biggest swings. Its regional carrier Envoy Air performed well. Mainline American and PSA Airlines did poorly. PSA operates on the East Coast.
The Impact of New York City Airports
Geography heavily influences delay statistics. A look at New York City airports in July 2026 illustrates this. Performance was bad across the board, but some airlines were worse. The analysis combined John F. Kennedy and LaGuardia for American, Delta, and JetBlue. It used Newark for United.
The results showed relative consistency among the three largest network carriers. JetBlue was relatively bad, as expected. United was slightly better at getting planes in on time. Delta was slightly better at keeping delays shorter. The blog concludes that systemwide data matters, but individual airport results will vary. Endeavor for Delta and PSA for American appear to be the regional airlines passengers might wish to avoid.